

Recent data from Inmuebles24, one of Mexico’s largest online property marketplaces, offers a snapshot of asking prices in the country’s three upcoming World Cup host cities — Mexico City, Guadalajara and Monterrey. The figures appear straightforward on the surface, but some context makes them more useful.
Based on the data, monthly rents for a 65-square-meter (m²) property average from 18,000 to 25,000 pesos, depending on the city. For a 100 m² property, rents range from 25,000 to 35,000 pesos, with Mexico City and Monterrey at the higher end.
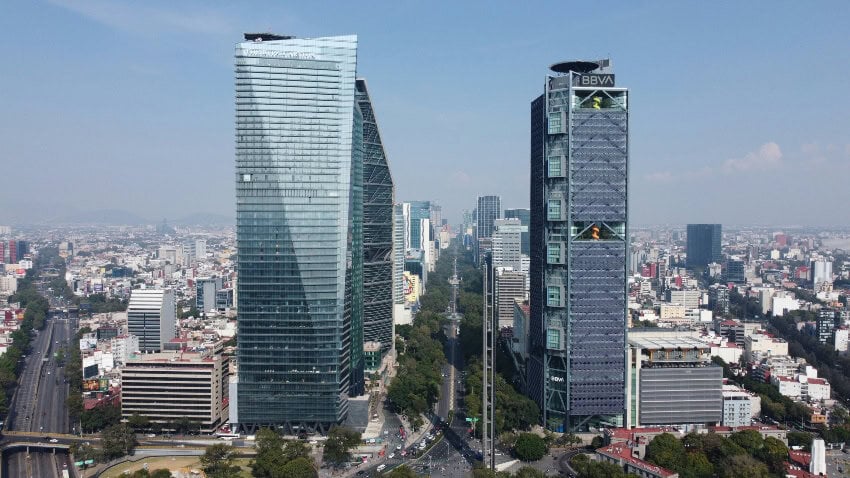
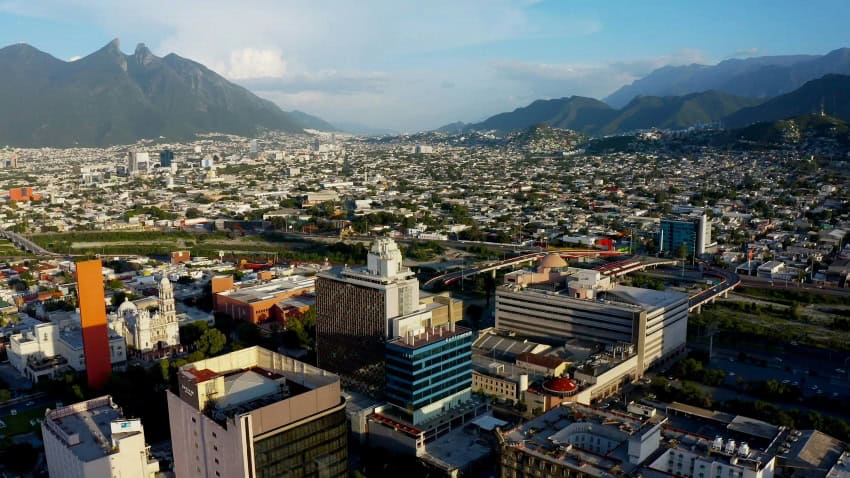
On the sales side, home prices are also expressed per square meter, but without the monthly rental dimension. In Mexico City, home sales average between 47,000 to 54,000 pesos per m², Guadalajara around 56,000 to 60,000 pesos per m², with Monterrey reaching into the 70,000 to 80,000 peso range. In practical terms, that puts a 100 m² property somewhere between roughly 4.7 million and 7.5 million pesos.
Those numbers are the headline, but it’s worth digging a little deeper: Do they reflect what most people are actually paying?
What the data is really showing
Because the source is a listings platform, this data reflects asking prices rather than completed transactions. It shows what sellers and landlords are bringing to market, not necessarily where deals are closing.
That distinction matters. In most markets, some properties transact close to asking, while others sit and over time adjust downward, and ultimately sell or rent for less. Listing data captures the full range of expectations, not the final negotiation.

There is another layer that has an even bigger impact on how these numbers should be read.
When ‘average’ doesn’t mean typical
The report presents “average” prices, but in datasets like this, that usually means a mean average. And a mean can be influenced by a relatively small number of higher-end listings.
In cities like Mexico City and Monterrey, a handful of luxury rentals or premium new developments can push the overall average upward. Even if most renters or buyers are operating below those levels, those higher-priced properties still carry equal weight in the calculation.
The result is a number that can feel elevated compared to what many people experience in the market. A median price would often give a clearer picture of what is typical, but that isn’t what’s being shown here.
What kind of properties are included
Although the data refers broadly to “homes,” the pricing strongly suggests that much of it reflects urban apartments. In major cities, newer condominium developments and well-presented listings tend to dominate online platforms, and those properties typically carry higher prices per square meter.
A 100 m² apartment in a desirable neighborhood with modern finishes can reasonably fall into the 5 to 7 million peso range in these cities. That does not mean all properties of that size are priced that way. Older homes, properties outside central areas, or listings that are less aggressively marketed often trade at lower levels and may be underrepresented in this kind of dataset.
The limits of price per square meter
Price per square meter is a useful tool, but it only goes so far.
Smaller properties tend to carry a higher price per meter, while larger homes usually see that number come down. Beyond that, square meter pricing does not account for layout, natural light, finishes or how a property is presented. Two properties with similar size can vary widely in price once those factors are considered.
That is why averages built on price per square meter can point in the right direction, but don’t always tell the full story.
A more practical way to read the market
Data like this is helpful as a broad indicator. It confirms that pricing in Mexico City, Guadalajara and Monterrey remains strong, particularly in well-located, newer inventory.
At the same time, it should not be taken as a direct reflection of what most people are paying. Markets are more varied than a single average suggests. Inventory has expanded in many areas, pricing is not always consistent, and while some properties move quickly when everything lines up, others take time and require adjustments.
For buyers and renters, the more reliable approach is still to look at comparable properties — what has actually rented or sold in a specific area with similar characteristics. That is where pricing becomes grounded in reality rather than averages.
The bottom line
The data from Inmuebles24 offers a useful snapshot of asking prices in Mexico’s largest urban markets. But because it is based on listings and mean averages, it can be influenced by higher-end properties and may not reflect the most common transaction.
Averages can be useful, but in real estate, they rarely tell the full story.
Glenn Rotton is a real estate agent with eight years of experience in San Miguel de Allende. Originally from Seattle, he has lived in Mexico for twelve years with his husband, Kiang Chong Ovalle, and their dog, Angus. Read more about Glenn here.

")