



In 2023, Mexico dethroned China as the top exporter to the United States, the world’s largest economy.
Since then, Mexico has remained the top exporter to the U.S., occupying the No. 1 position in 2024, 2025 and the first five months of 2026.
Before Mexico ascended to the enviable position of No. 1 foreign supplier to the U.S., China held the top spot for over a decade. China first became the leading exporter to the U.S. in 2007. Canada snatched back the top spot in 2008 before ceding the position to the East Asian country once again in 2009.
For 14 consecutive years between 2009 and 2022, China was the top exporter to the United States. China was able to get to that position thanks to its vast, low-cost, export-oriented manufacturing sector, the establishment of permanent normal trade relations with the U.S. in 2000 and its membership in the World Trade Organization from 2001 onwards.
In the early 2000s, the country became known as “the world’s factory,” and in 2013, China became the planet’s largest trading nation.
But China’s share of the U.S. market for imports began to decline during the first Trump administration, mainly due to the U.S. government’s imposition of new tariffs on Chinese goods.
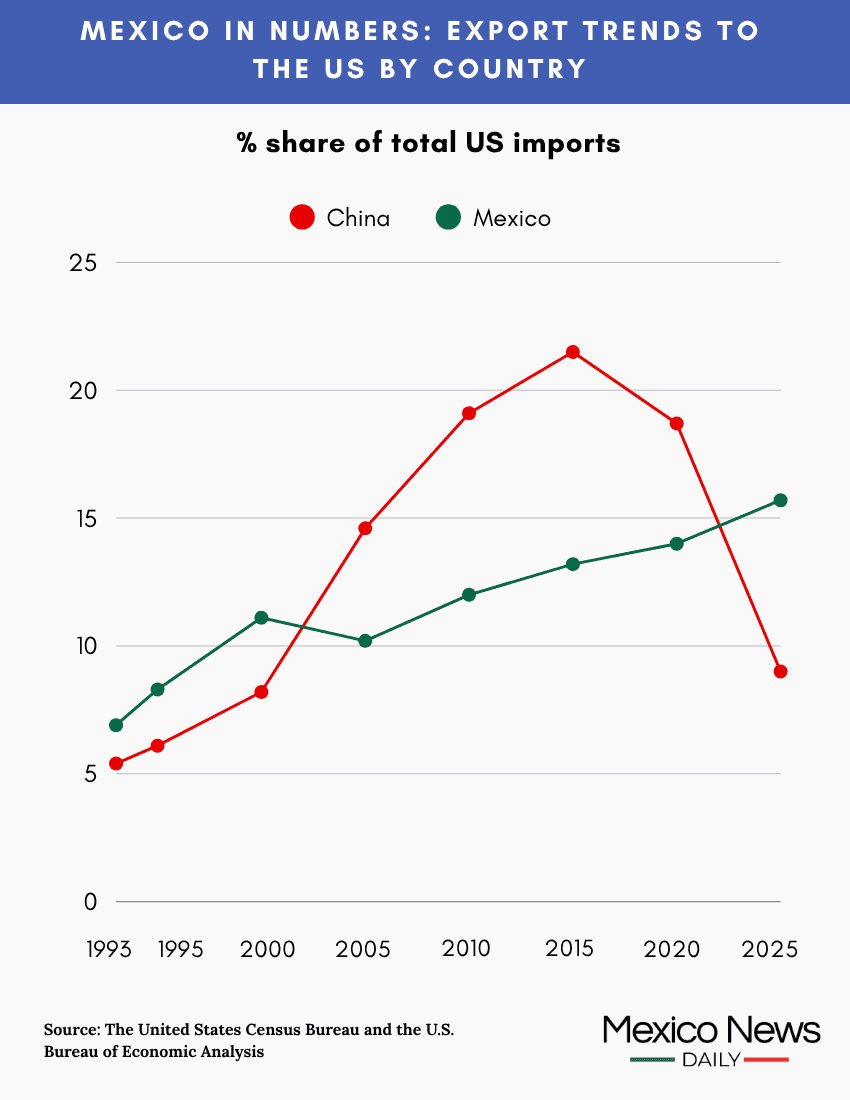

Mexico, among other countries, benefited from the U.S.-China trade war, as the United States “decoupled” from a country it had grown to rely on heavily for all manner of products.
Mexico — which has emerged as a major nearshoring destination in recent years — increased exports to its northern neighbor to the point where, as mentioned above, it became the top exporter to the United States in 2023.
Meanwhile, the shares of the U.S. market for imports held by Canada and China — each of which was once the largest exporter to the United States — declined as the U.S. spent more on goods made in lower-cost economies, such as Mexico and China.
In this “Mexico in Numbers” article, we look at how Mexico, Canada, Japan and China’s shares of the U.S. market for imports have changed over the past 30 years or so.
We begin in 1993 — the year before the North American Free Trade Agreement (NAFTA) took effect — then examine the data for 1995 before continuing in five‑year steps right up to 2025.
*All the data in this article comes from the United States Census Bureau and the U.S. Bureau of Economic Analysis.
1993: Canada is the pre-NAFTA supremo
In 1993 — the year before a North American free trade zone was established with NAFTA — the United States imported goods worth US $580.65 billion.
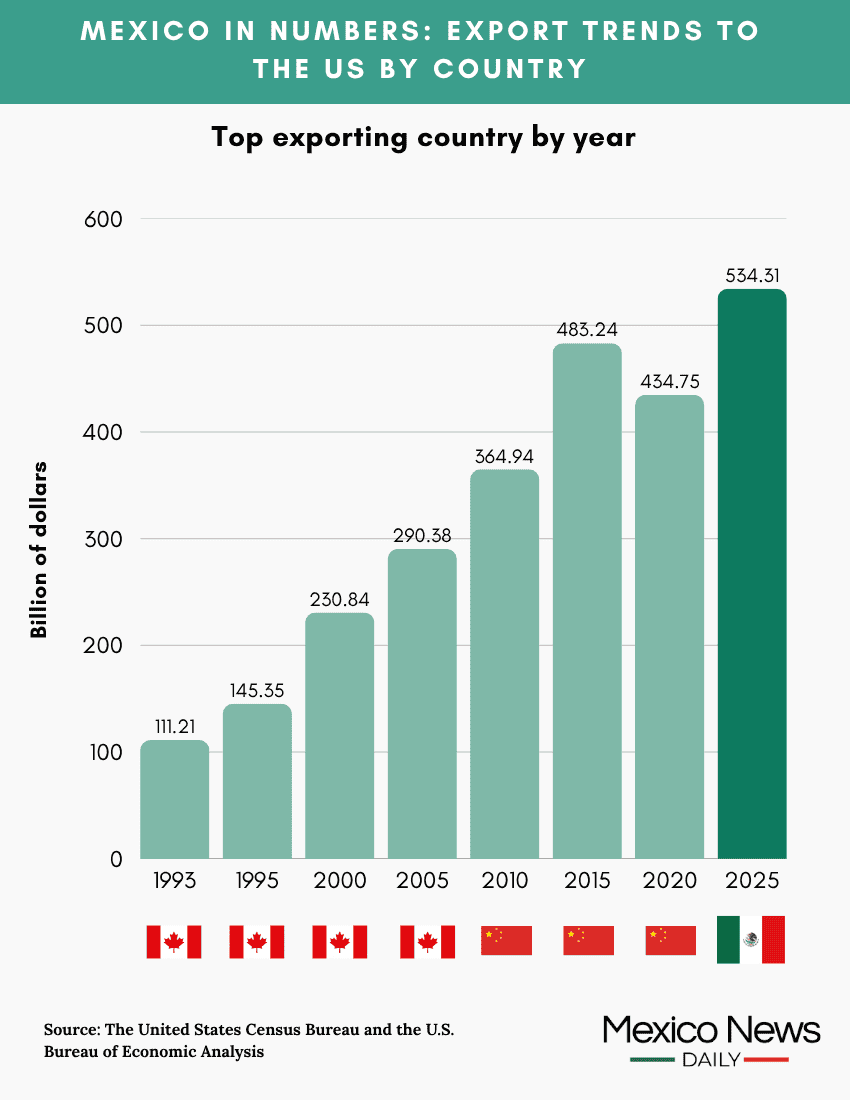
Canada was the top exporter to the United States that year, shipping goods worth $111.21 billion to its southern neighbor. Thus, Canada had a 19.1% share of the United States total market for imports.
In 1993, neither Mexico nor China was the second-largest exporter to the United States. That distinction went to Japan, which exported goods worth $107.25 billion to the U.S. in 1993, giving the Asian nation an 18.5% share of the U.S. market for imports.
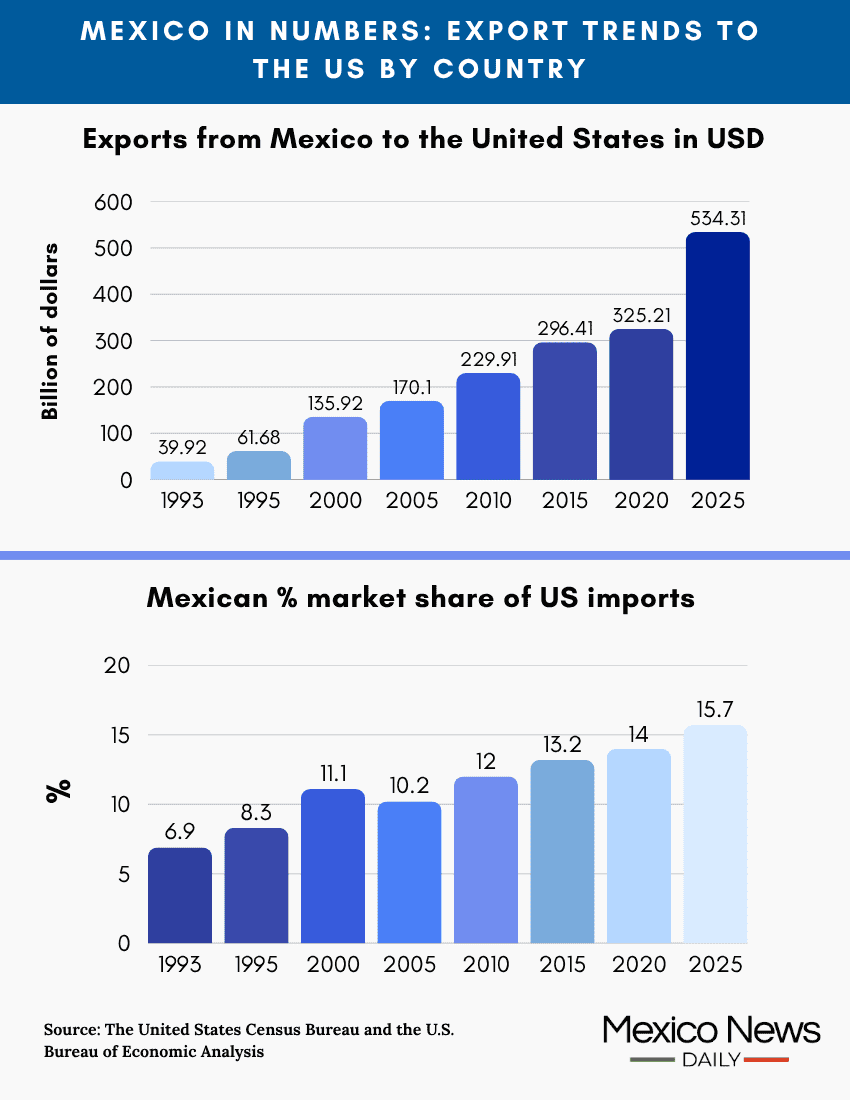
Mexico exported goods worth $39.92 billion to the United States in 1993, giving it a 6.9% share of the U.S. market for imports.
China’s exports to the United States were worth $31.54 billion, giving it a 5.4% share of the U.S. market for imports — just one-quarter of the percentage it would achieve around two decades later.

1995: Canada still on top, but Mexico makes up ground
In 1995, the United States imported goods worth $743.44 billion, an increase of 28% compared to 1993.
Canada was again the top exporter to the United States, sending goods worth $145.35 billion to its southern neighbor, an increase of 30.7% compared to pre-NAFTA 1993.
Canada thus had a 19.5% share of the U.S. market for imports, an increase of 0.4 percentage points compared to 1993.
In 1995, Japan was still the second-largest exporter to the United States, shipping goods worth $123.48 billion to the U.S. Japan thus had a 16.6% share of the U.S. market for imports, a decline of 1.9 percentage points compared to 1993.
Mexico was the third-largest exporter to the United States in 1995. It shipped goods worth $61.68 billion north, an increase of 54.5% in the space of just two years. Mexico had an 8.3% of the U.S. market for imports in 1995, an increase of 1.4 percentage points compared to 1993.
China also increased its exports to the U.S. and its share of the U.S. market for imports in 1995. Its exports were worth $45.54 billion, a 44.4% increase compared to two years earlier. China’s share of the U.S. market for imports increased to 6.1% from 5.4% in 1993.
2000: Canada remains No. 1 despite losing share of the US market for imports
The value of the United States’ total imports once again exceeded $1 trillion in 2000, having first surpassed that level in 1999. In 2000, the U.S. imported goods to the tune of $1.22 trillion.
Canada was once again the largest exporter to the United States, shipping goods worth $230.84 billion to its southern neighbor, an increase of 58.8% compared to 1995. However, Canada’s share of the U.S. market for imports fell to 18.9%, a decline of 0.6 percentage points compared to five years earlier.
In 2000, Japan was once again the second-largest exporter to the United States, sending goods worth $146.48 billion to the U.S., an increase of 18.6% compared to 1995. However, Japan’s share of the U.S. market for imports fell to 12%, a decline of 4.6 percentage points compared to five years earlier.
In contrast, Mexico’s share of the U.S. market for imports increased to 11.1%, an increase of 2.8 percentage points compared to 1995. Mexico’s exports to the United States were worth $135.92 billion in 2000, an increase of an impressive 120.4% compared to five years earlier. Mexico was closing in on Japan.
China was on the move as well. The value of China’s exports to the U.S. exceeded $100 billion for the first time ever in 2000, coming in at $100.02 billion. China had an 8.2% share of the U.S. market for imports in 2000, up 2.1 percentage points compared to 1995.

2005: Canada still in front as China moves ahead of Japan and Mexico
In 2005, the United States imported goods worth $1.67 trillion, a 36.9% increase compared to five years earlier.
Canada remained the top exporter to the U.S., sending goods worth $290.38 billion to its southern neighbor, a 25.8% increase compared to 2000. However, Canada’s share of the U.S. market for imports continued to fall, declining 1.5 percentage points in the space of five years to 17.4%.
Meanwhile, China’s exports to the United States reached $243.47 billion in 2005, an increase of 143.2% compared to 2000. Thus China was the second-largest exporter to the United States, ahead of both Mexico and Japan. China first moved into second place in 2003, beating out Mexico for that spot after exceeding Japan’s export total the previous year. In 2005, China had a 14.6% share of the U.S. market for imports, an increase of 6.4 percentage points compared to five years earlier.
Mexico’s exports to the United States were worth $170.1 billion in 2005, a 25.1% increase compared to five years earlier. However, its share of the U.S. market for imports fell to 10.2%, a decline of 0.9 percentage points compared to 2000.
Japan’s share of the U.S. market for imports was 8.3% in 2005, down 3.7 percentage points from 2000. Japan shipped exports worth $138 billion to the U.S. in 2005.
2010: China is the new leader; Mexico gains market share as Canada continues to retreat
The United States spent a total of $1.91 trillion on imports in 2010, a 14.4% increase compared to 2005.
China was easily the top exporter to the U.S. in 2010, shipping goods worth $364.94 billion to the world’s largest economy. China thus had a 19.1% share of the U.S. market for imports, up 4.5 percentage points from five years earlier.
As noted in the introduction to this article, China first became the top exporter to the U.S. in 2007 before relinquishing the position to Canada in 2008. China retook the top spot in 2009 and maintained an iron grip on it through 2022.
In 2010, Canada found itself in second spot in the list of largest exporters to the United States, sending goods worth $277.65 billion to its southern neighbor. That dollar figure represented a 4.4% decrease compared to Canada’s sales to the U.S. five years earlier. Canada’s share of the U.S. market for imports was 14.5% in 2010, down 2.9 percentage points from five years earlier.
Meanwhile, the value of Mexico’s exports to the U.S. increased 35.2% compared to 2005 to reach $229.91 billion. Mexico’s share of the U.S. market for imports was 12% in 2010, an increase of 1.8 percentage points compared to 2005. In 2010, Mexico remained the third-largest exporter to the United States.
Japan was the fourth-largest exporter to the United States in 2010, sending goods worth $120.54 billion to the U.S., a decrease of 12.6% compared to five years earlier. Japan’s share of the U.S. market for imports was 6.3%, a decrease of two percentage points compared to 2005.

2015: China remains No. 1 with a 21.5% share of the US market for imports
In 2015, the United States spent $2.25 trillion on imports, a 17.8% increase compared to 2010. Of every $5 spent on imported goods, more than $1 was used to purchase Chinese products.
That’s right, China’s share of the U.S. market for imports was above 20% in 2015 — 21.5% in fact, an increase of 2.4 percentage points compared to five years earlier. The total value of the goods China shipped to the U.S. in 2015 was $483.24 billion, an increase of 32.4% compared to 2010. Thus, China was easily the largest exporter to the United States in 2015.
Meanwhile, Mexico pipped Canada for second place. Mexico’s exports to its northern neighbor were worth $296.41 billion in 2015, just ahead of Canada’s exports to the U.S., which totaled $296.15 billion.
Both countries had a 13.2% share of the U.S. market for imports in 2015. Mexico’s share increased 1.2 percentage points compared to five years earlier, while Canada’s share declined 1.3 points.
In 2015, Japan clung onto fourth place in the list of the largest exporters to the United States, although Germany wasn’t far behind. Japan’s exports were worth $131.36 billion, a 9% increase compared to five years earlier. However, Japan’s share of the U.S. market for imports was just 5.8%, a decrease of 0.5 percentage points compared to 2010.
2020: China still No. 1 but its share of the US market falls
In 2020, the United States imported goods worth $2.33 trillion, an increase of 3.6% compared to 2015.
China was the top exporter to the United States in 2020, shipping goods worth $434.75 billion to the U.S. China had an 18.7% share of the U.S. market for imports in 2020, a year of economic turmoil due to the COVID pandemic. Its share of the U.S. market was 2.8 percentage points lower than in 2015. The U.S.-China trade war was underway.
Meanwhile, Mexico sent goods worth $325.21 billion to the United States in 2020, an increase of 9.7% compared to 2014. It had a 14% share of the U.S. market for imports, up 0.8 percentage points from 2015, and remained the second-largest exporter to the United States.
Canada’s exports to the United States were worth $270.31 billion in 2020, a decrease of 8.7% compared to 2015. Canada had an 11.6% of the total U.S. market for imports, a decrease of 1.6 percentage points compared to five years earlier.
Japan remained the fourth-largest exporter to the United States, although the value of its exports and its share of the U.S. market for imports both declined.
Japan sent goods worth $119.49 billion to the U.S. in 2020, a 9% decrease compared to 2015. Its share of the U.S. market for imports was 5.1%, a drop of 0.7 percentage points compared to five years earlier.
2025: Mexico is the top exporter to the US
In 2025, the United States imported goods worth US $3.41 trillion, a 46.4% increase compared to 2020.
Mexico was the largest exporter to the U.S. last year, shipping goods worth $534.31 billion to its northern neighbor, a 64.3% increase compared to 2020. Mexico had a 15.7% share of the total U.S. market for imports, an increase of 1.7 percentage points compared to five years earlier.
Canada exported goods worth $381.92 billion to the United States in 2025, making it the second-largest exporter to the U.S. While the dollar value of its exports increased 41.3%, Canada’s share of the U.S. market for imports fell 0.4 percentage points from 11.8% in 2020 to 11.2% in 2025.
China ranked as the third-largest exporter to the United States in 2025. The East Asian economic powerhouse shipped goods worth $308.65 billion to the U.S. last year, a decline of 29% compared to 2020. China had a 9% share of the U.S. market for imports, a decline of 9.7 percentage points compared to five years earlier.
Meanwhile, Japan could only manage seventh place in the list of the largest exporters to the United States, behind Mexico, Canada, China, Taiwan, Vietnam and Germany. Japan’s exports to the U.S. were worth $145.84 billion last year, a 22% increase compared to 2020. However, Japan’s share of the U.S. market for imports was just 4.3%, a decline of 0.8 percentage points compared to 2020.
Mexico News Daily