



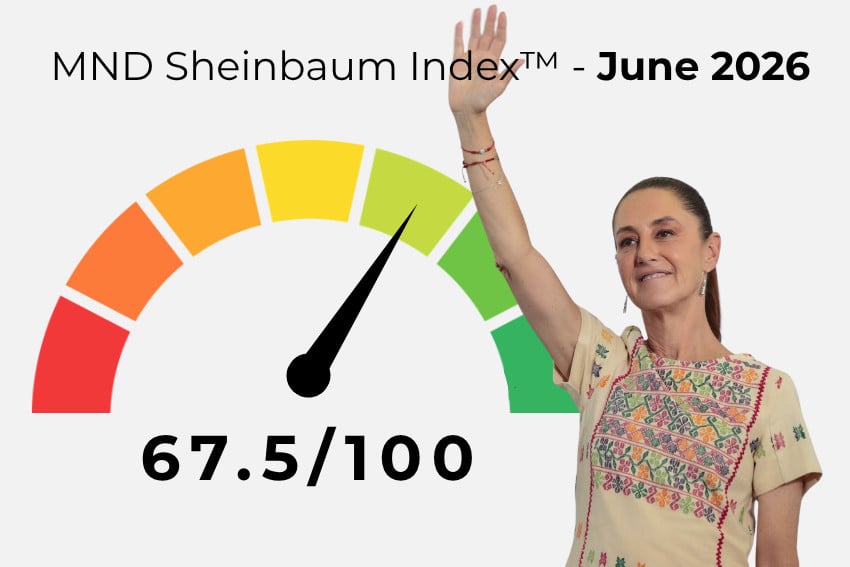
THE MND SHEINBAUM INDEX™
Measuring Mexico’s president beyond the polls
MND Intelligence · Fourth edition
Welcome to the fourth edition of the MND Sheinbaum Index™, an eight-pillar index designed to give our readers balanced, data-driven insight into the current situation in Mexico across a range of areas under the leadership of President Claudia Sheinbaum.
In this edition of the index — which mainly uses data from the month of June — the headline number is 67.5, representing an improvement of 2.7 points compared to the previous score. This is the highest MND Sheinbaum Index™ to date. A detailed summary of the latest results appears below.
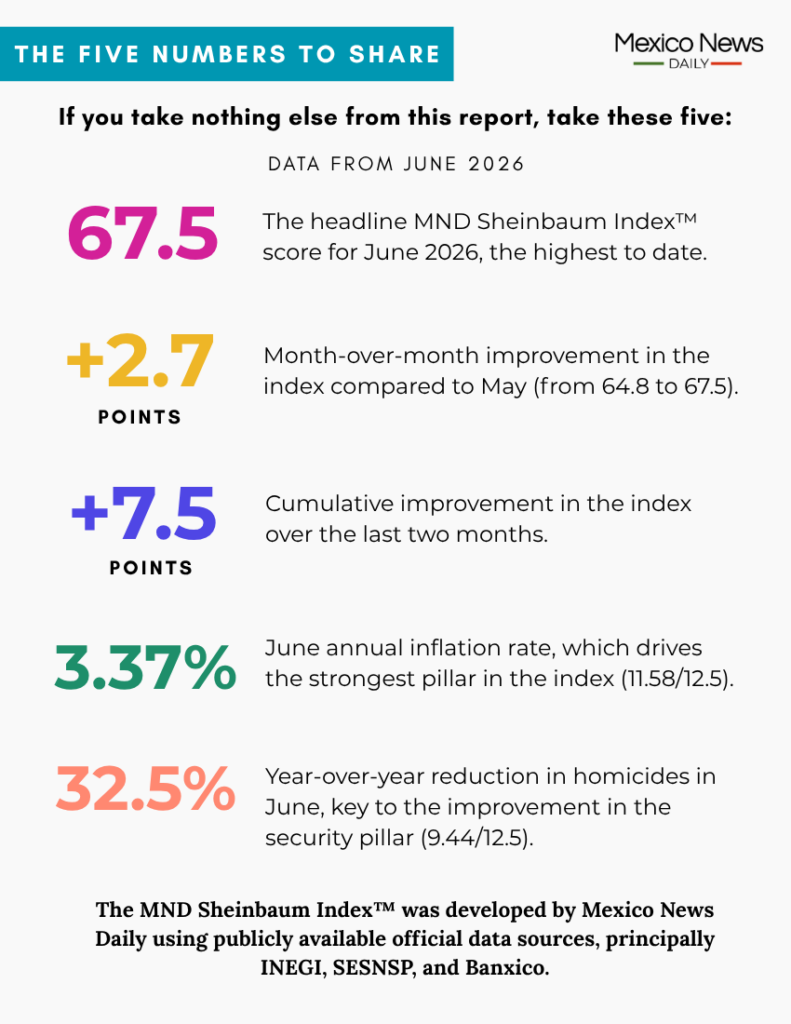
The MND Sheinbaum Index™ score has now improved in two consecutive months, increasing by 7.5 points in the period. An analysis of the index trend in the first half of 2026 also appears below.
The publication of this MND Sheinbaum Index™ score comes just over 22 months into Sheinbaum’s presidency at a time when the federal government is dealing with a range of challenges in its bilateral relationship with the United States — including ones related to security and trade — and at home, among which are modest (but improving) economic growth, high (but declining) levels of violence, ongoing teachers’ protests and large quantities of sargassum on Caribbean coast beaches.
If you need a reminder on how the index works and how each of the eight equally weighted pillars is scored, please read the second edition of the MND Sheinbaum Index™.
Before we look in detail at the latest results and examine the index trend in the first half of 2026, here is a short guide to the significance of a Sheinbaum Index score:
- 85–100: Exceptional — administration performing at a high level across nearly all indicators.
- 75–84: Excellent — administration performing well across most indicators.
- 60–75: Quite good, but room for improvement — meaningful strengths, some areas of concern.
- 50–60: Mixed — passing marks overall.
- Below 50: Broad underperformance — more indicators below benchmark than above.
The MND Sheinbaum Index™ trend between February and June
We saw the MND Sheinbaum Index™ score fall and rise in the period between February and June.

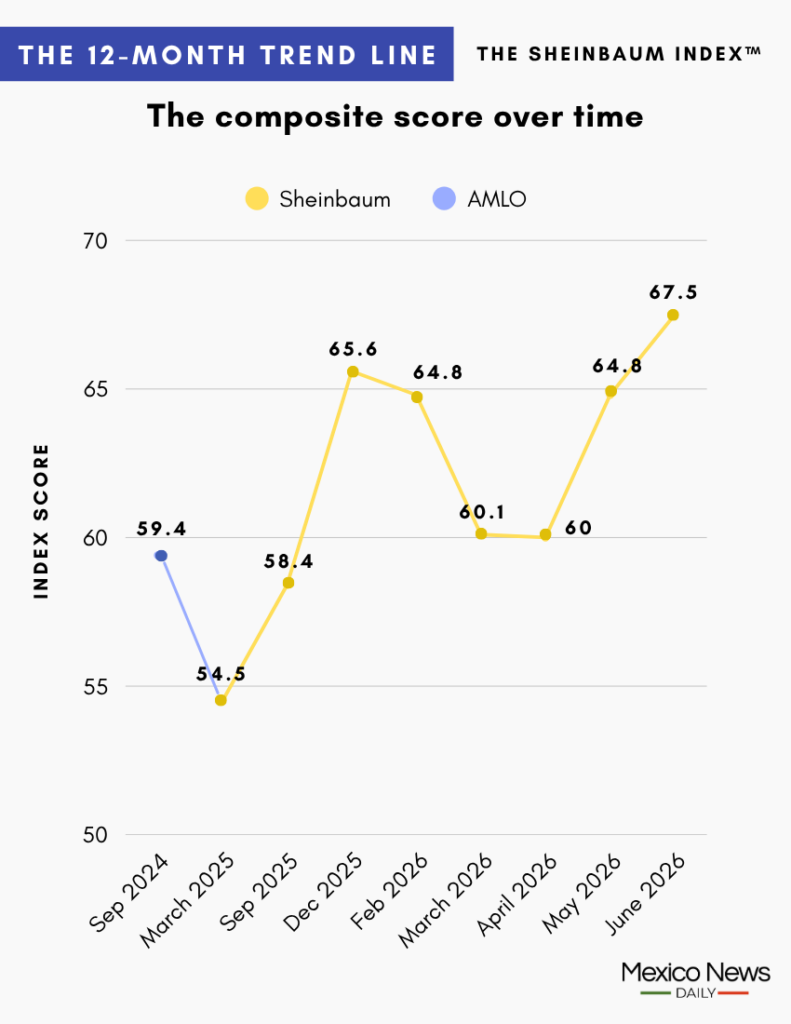
Factors such as inflation of around 4.5% in each of March and April, as well as annual economic growth of 0.5% or lower in those months, caused the index score to deteriorate to 60 from 64.8 in February, when inflation was very close to 4% and economic growth was above 1%.
The 4.8-point month-over-month improvement in the index score in May was mainly due to inflation falling compared to April, homicides declining at a faster annual pace and economic growth improving. We saw all those things happen again in June, compared to May, resulting in an additional 2.7-point month-over-month improvement in the index score.
MND Sheinbaum Index™ pillars for June 2026
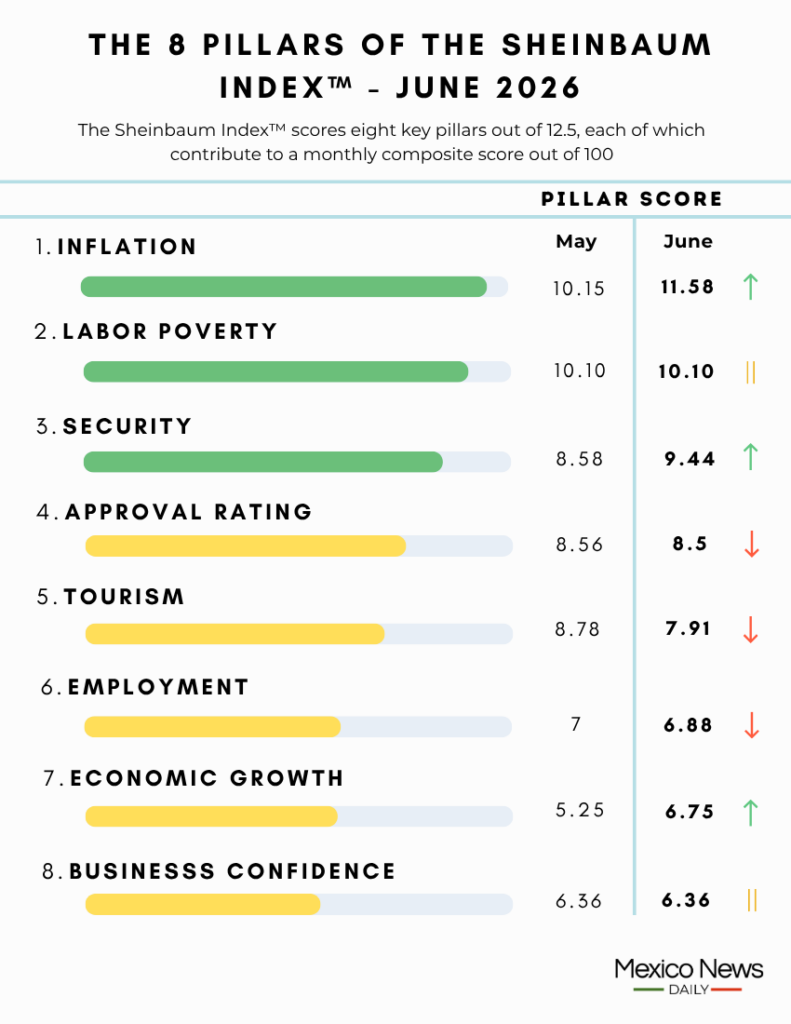
Each pillar is given a stoplight color indicating a strong performance (green), an average performance (yellow) or a poor performance (red). An upward-pointing arrow ⬆️ indicates that the pillar score improved compared to May. A downward-pointing arrow ⬇️ indicates a deterioration in the pillar score. A pause icon ⏸️ means there was no change in the pillar score compared to the previous month.
As you’ll see below, scores for three of the eight pillars improved in June compared to May. The scores for three others declined, while the scores for two pillars were unchanged.
Collectively, the improvements in the inflation, security and economic growth pillars were more significant than the deteriorations in the approval rating, tourism and employment pillars. Thus, the MND Sheinbaum Index™ score was able to increase 2.7 points compared to May to settle at 67.5.
🟢 ⬆️ INFLATION (11.58 out of 12.5)
In June, the inflation pillar was the top contributor to the overall index score for a second consecutive month.
Mexico’s annual headline inflation rate declined from 3.94% in May to 3.37% in June, the lowest rate for any month since December 2020 and just 0.37 percentage points above the Bank of Mexico’s 3% target.
The inflation pillar score consequently rose to 11.58 from 10.15 in May — a gain of 1.43 points.
🟢 ⏸️ LABOR POVERTY (10.10 out of 12.5)
The labor poverty pillar score was unchanged from May at 10.10. The labor poverty rate decreased 3.2 percentage points annually to 30.7% in the first quarter of 2026 — the same reading as May, as this pillar runs on a quarterly lag. Real incomes increased 7.4% year-over-year, also unchanged from last month.
For a second consecutive month, this pillar was the second biggest contributor to the overall index score.
🟢 ⬆️ SECURITY (9.44 out of 12.5)
The pace of homicide reduction accelerated in June for a second consecutive month. The year-over-year decline in homicides was 32.5% in June, per data presented at Sheinbaum’s July 14 press conference, up from 27.6% in May.
The security pillar score consequently rose from 8.58 in May to 9.44 in June. As a result of the increase, the security pillar moved into green light territory.
🟡 ⬇️ APPROVAL RATING (8.5 out of 12.5)
Sheinbaum’s average approval rating fell slightly to 68% in June from 68.5% in May. Thus, the approval rating pillar score declined from 8.56 in May to 8.5 in June.
Per El Financiero’s June poll, Sheinbaum’s approval rating was 68%, a decline of one point compared to May. As there was no new Enkoll/El País/W Radio poll on Sheinbaum in June, we carried over the poll’s approval rating from May, which was 68%.
🟡 ⬇️ TOURISM (7.91 out of 12.5 — This pillar has a one-month lag)
International arrivals increased 5.3% year-over-year in May, the data period used for June’s index. That represents a slowdown from the 8.1% rise recorded in April, pulling the tourism pillar score down from 8.78 in May to 7.91 in June.
🟡 ⬇️ EMPLOYMENT (6.88 out of 12.5)
Mexico’s unemployment rate was 2.9% in June, up 0.1 percentage points from May. The rate remained below the 3% neutral benchmark, but the slight increase compared to May resulted in a slightly lower score for this component of the employment pillar.
The informality rate increased 0.2 percentage points year-over-year in June, an improvement on the 0.3-point rise recorded in May.
The improvement in the informality component score was just outweighed by the deterioration in the unemployment component score, resulting in a slight decline in the pillar score from 7 in May to 6.88 in June.
While unemployment in Mexico is quite low, the percentage of workers employed in the informal economy is very high, at 55% in June.
🟡 ⬆️ ECONOMIC GROWTH (6.75 out of 12.5)
Year-over-year economic growth in June was 1.7%, according to preliminary data from INEGI — an improvement on May’s 1.1% preliminary reading.
The economic growth pillar score thus rose from 5.25 in May to 6.75 in June. The improvement allowed the pillar to move into yellow light territory from red light designations in each of the first three Sheinbaum indexes we published. Of the four indexes to date, this one is the first in which the economic growth pillar is not the worst performing pillar.
The improved annual growth rate in June has been attributed, in part, to an increase in consumer spending related to the FIFA men’s World Cup, which Mexico co-hosted with the United States and Canada. INEGI’s preliminary economic growth data is often revised upward, meaning that the annual expansion in June may turn out to be higher than 1.7%.
🟡 ⏸️ BUSINESS CONFIDENCE (6.36 out of 12.50)
Mexico’s business confidence score, as measured by a monthly INEGI survey, was 48.2 in June, unchanged from April. That score is below the neutral benchmark of 50. In late 2024, when Sheinbaum was at the start of her six-year term, the business confidence score was around 52.
In June, the score for the foreign direct investment component of the pillar also remained unchanged as the latest available data was once again the Q1 2026 FDI growth figure reported by the federal Economy Ministry in late May. Annual FDI growth in the first quarter was 10.4%.
With no movement in either component, the business confidence pillar score was unchanged at 6.36.
What to watch
The next MND Sheinbaum Index™ will focus on the month of July.
Here are three things to look out for in the July Index, which we will publish in early September.
- Inflation: Data for the first half of July indicates that the score for the inflation pillar will continue to improve. INEGI reported on July 23 that the annual headline rate was 3.10% in the first 15 days of July, the lowest for any half-month period since the second half of December 2020.
- Tourism: The July index will include data on international arrivals in June, a month in which Mexico hosted 12 World Cup matches and welcomed visitors from around the world. It is thus likely that data will show that there was a significant annual increase in international arrivals in June. If that is the case, the tourism pillar score will increase, giving a boost to the overall index score.
- Labor poverty: INEGI will publish second quarter data on labor poverty and real income growth in late August. That data will replace the first quarter data we used in this edition of the MND Sheinbaum Index™ and the two previous ones. Therefore, it is virtually certain that we will see a change in the labor poverty pillar score in the next index.
Mexico News Daily
* MND acknowledges that President Sheinbaum does not directly control outcomes in all eight pillars. For example, global commodity prices and tariff decisions in Washington can affect Mexico’s inflation and growth rates. The Index measures what is happening in Mexico on Sheinbaum’s watch.