



Anyone who has been living in or visiting Mexico for an extended period of time knows that at certain times this century, one US dollar bought significantly fewer Mexican pesos than it does today.
I’m talking about 25 years ago, 20 years ago, 15 years ago.
I’m not talking about 10 years ago, when the greenback rose above 20 to the peso, or six years ago, when the USD:MXN exchange rate exceeded 25 at the onset of the COVID pandemic.
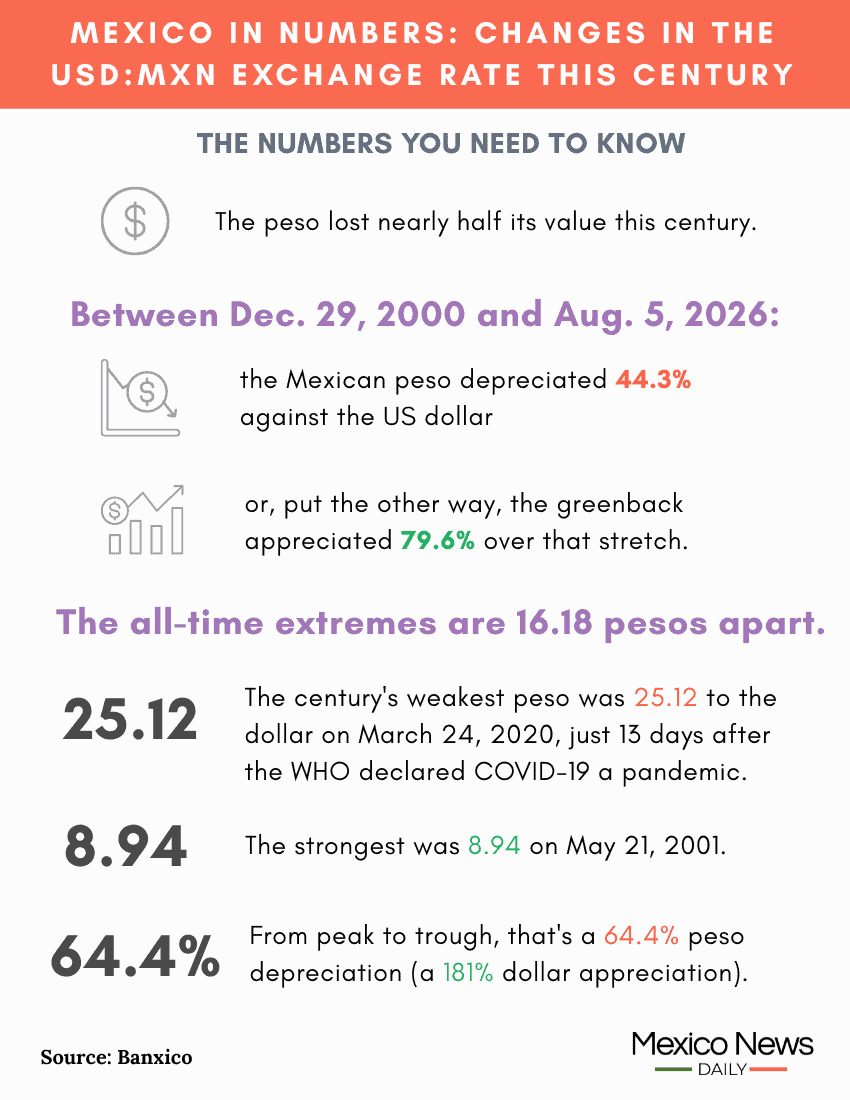
At the close of trading on Aug. 5 (i.e. yesterday), one US dollar was worth 17.24 Mexican pesos, according to the Bank of Mexico. That puts the current USD:MXN exchange rate more or less on par with the prevailing rates in December 2015 and June 2023.
This “Mexico in Numbers” article will show you how the USD:MXN exchange rate has changed this century. The aim is not to examine in depth why the rate has changed over the past 25 years, although I do mention a few factors that have caused the peso to appreciate or depreciate at different times this century.
Before we look closely at the USD:MXN exchange rate fluctuations since Jan. 1, 2001, here are two key numbers relevant to our topic.
* N.B. — All of the USD:MXN exchange rate data in this article comes from the Bank of Mexico (Banxico). Exchange rate data from 1954 to 2026 can be downloaded from the central bank’s website.

25.12
This is the highest USD:MXN exchange rate this century, and indeed of all time. This was the prevailing rate on March 24, 2020 — 13 days after the World Health Organization declared the COVID-19 outbreak a pandemic.
8.94
This is the lowest USD:MXN exchange rate this century. This was the prevailing rate on May 21, 2001 — 113 days before two planes crashed into the Twin Towers in New York City.
Changes in the USD:MXN exchange rate this century
For each of the five-year intervals that appear below, I note the prevailing USD:MXN exchange rates on the first trading day of each year and on June 30 (or on the closest trading day to that date). I also highlight the highest and lowest exchange rates in each period.
2001-2005: The peso weakens almost 9%
The Mexican peso traded at 9.71 to the US dollar on Jan. 2, 2001, the second calendar day of this century. On June 29, 2001, the USD:MXN exchange rate was 9.07. Just over a month earlier, as noted above, the peso traded at 8.94 to the greenback, its strongest position this century.
On Jan. 2, 2002, the USD:MXN exchange rate was 9.10, while on July 1 of that year it was 9.92. On September 4, 2002, the USD:MXN exchange rate went above 10 for the first time this century. The peso previously traded at more than 10 to the dollar in 1998 and early 1999.
On Jan. 2, 2003, the peso traded 10.36 to the dollar, while on June 30 of that year the USD:MXN rate was 10.43.
On Jan. 2, 2004, the USD:MXN rate was 11.08, while on June 30 of that year it was 11.52. The USD:MXN exchange rate reached its highest point of the 2001-2005 period on May 10, 2004, when one greenback bought 11.63 pesos.
On Jan. 3, 2005, one US dollar was worth 11.20 pesos, while the USD:MXN rate was 10.77 on June 30 of that year and 10.63 on Dec. 30.
Thus, the peso depreciated 92 centavos, or around 8.7%, against the US dollar between Jan. 1, 2001 and Dec. 30, 2005. The peso’s weakest point in the period (11.63 to the dollar) represented a 23.1% depreciation compared to its strongest point (8.94).
2006-2010: The pace of peso depreciation quickens
The USD:MXN exchange rate on Jan. 2, 2006, was 10.62, while on June 30 it was 11.27.
On the first trading day of 2007 — Jan. 2 — one US dollar bought 10.78 pesos, while a greenback purchased 10.79 pesos on June 29 of that year.
On Jan. 2, 2008, the peso traded at 10.89 to the dollar, while on June 30 of that year the Mexican currency was stronger at 10.30 to the greenback. On Aug. 5, 2008, the peso reached its strongest position of the 2006-10 period, trading at 9.91 to the dollar.
On Jan. 2, 2009, the peso traded at a much weaker 13.76 to the dollar and exactly two months later, on March 2 , the currency fell to its weakest point of the 2006-10 period — 15.36 to the dollar at a time when the global financial crisis had taken a heavy toll on the Mexican currency. By June 30, 2009, the peso had significantly recovered to trade at 13.17 to the dollar.
On the first trading day of 2010 — Jan. 4 — the peso was even stronger at 12.92 to the dollar. The USD:MXN exchange rate was 12.84 on June 30, 2010, and 12.34 on Dec. 31 of that year.
The peso depreciated 13.9% between Jan. 2, 2006 and December 31, 2010. The peso’s weakest point in the period (15.36 to the dollar) represented a 55% depreciation compared to its strongest point (9.91). That wild swing occurred in the space of just seven months.
2011-2015: The pace of peso depreciation quickens again, doubling to almost 30%
On Jan. 3, 2011, the USD:MXN exchange rate was 12.25, while on June 30 of that year it was 11.72. The peso’s strongest point in this five-year period was a rate of 11.50 to the greenback on May 2, 2011.
On the first trading day of 2012 — Jan. 2 — the peso traded at 13.93 to the greenback, whereas on June 29 the USD:MXN rate was 13.40
On Jan. 2, 2013, the peso was stronger at 12.74 to the greenback, while on July 1 of that year it traded at 12.91 to the dollar.
On Jan. 2, 2014, one greenback bought 13.10 pesos, while on June 30 the peso was slightly stronger at 12.97 to the dollar.
On the first trading day of 2015 — Jan. 2 — the USD:MXN rate was 14.82, while the dollar was significantly stronger on June 30 of that year, buying 15.68 pesos. The greenback continued strengthening in the second half of 2015, reaching its strongest point of the 2011-15 period on Dec. 14, when it bought 17.37 pesos.
A week before the peso tumbled to that point, Reuters reported that the Mexican currency had fallen to “a more than two-month low” as crude oil prices hovered near 7-year lows. Then-Bank of Mexico Governor Agustín Carstens said at the time that global volatility could continue to hit the peso in December 2015. And Carstens was right — the peso depreciated further from the 16.90 rate on Dec. 7, 2015, the date on which his remarks to Reuters were published.
In the five years between January 2011 and December 31, 2015 — when the USD:MXN rate was 17.24 — the peso depreciated 28.9%. The peso’s weakest point in the period (17.37 to the dollar) represented a 33.8% depreciation compared to its strongest point (11.50).
2016-2020: Pandemic drags peso down to its weakest level ever
On Jan. 4, 2016, the USD: MXN exchange rate was 17.35, while on June 30, one greenback bought 18.46 pesos.
On April 29, 2016, the peso traded at its strongest level in the 2016-2020 period — 17.17 to the greenback. However, later in 2016 — on Nov. 10 to be exact — the peso traded above 20 to the dollar for the first time ever. The peso’s depreciation to above 20 to the dollar came two days after Donald Trump won the 2016 presidential election.
On Nov. 10, 2016, Reuters reported that the Mexican peso had sunk again, “taking its biggest two-day tumble in more than 20 years as investors worried about how U.S. president-elect Donald Trump’s policies could hit exports from Latin America’s second largest economy.”
Earlier in 2016, as the peso approached 20 to the dollar, memes appeared showing the Mexican 20-peso banknote with the words “new one-dollar bill” superimposed on it.
On the first trading day of 2017 — Jan. 2 — the peso was still above 20 to the dollar, with the USD:MXN rate at 20.73. On June 30 of that year, the peso was significantly stronger at 18.06 to the greenback.
On Jan. 2, 2018, the USD:MXN exchange rate was 19.48, while on June 30 of that year it was 19.69.
On Jan. 2, 2019, one greenback bought 19.58 pesos while on July 1 of that year a dollar purchased 19.07 pesos.
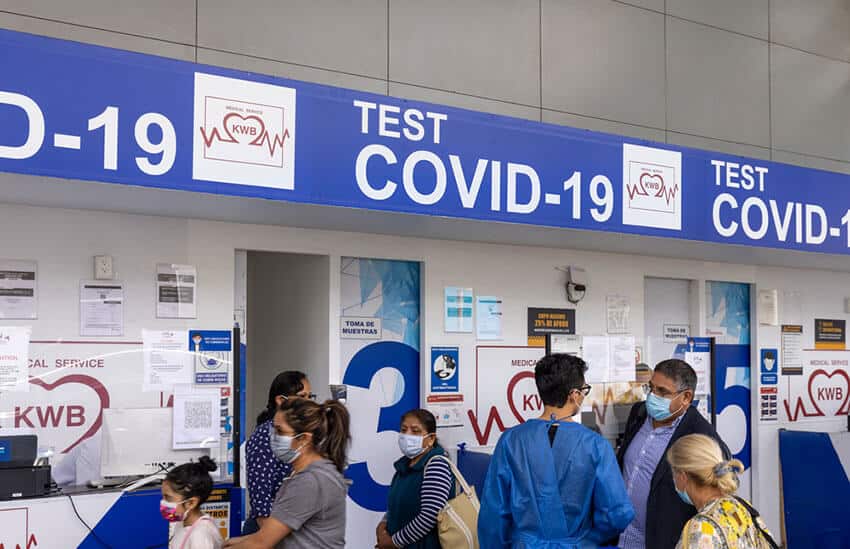
On the first trading day of 2020 — Jan. 2 — the peso traded at 18.88 to the dollar, while on June 30 it was significantly weaker at 23.08 to the greenback.
As noted at the start of this article, the peso depreciated to its weakest level ever — 25.12 to the dollar — on March 24, 2020, at the onset of the COVID pandemic.
On March 23, 2020, Mexico News Daily reported that the peso had fallen to “a new record low” against the US dollar “as the coronavirus pandemic continues to take a heavy toll on economies around the world.”
At the time, MND reported: “The financial group Monex said that the peso is facing ‘considerable stress’ due to the economic impact of COVID-19 around the world. As the pandemic worsens, investors have rushed to free themselves of high-risk currencies, such as the peso, in favor of the US dollar, which is regarded as the ultimate safe-haven currency.”
By the end of 2020, the peso had substantially recovered, trading at 19.90 to the dollar on Dec. 31.
Between January 2016 and December 2020, the peso depreciated 12.8%. The peso’s weakest point in the period (25.12 to the dollar) represented a 31.6% depreciation compared to its strongest point (17.17).
2021-2025: The value of the peso against the dollar goes up, not down!
On Jan. 4, 2021 — the first trading day of this decade — the USD:MXN exchange rate was 19.84, while on June 30 of that year one dollar bought 19.90 pesos. Later in the year, on Nov. 26, the peso depreciated to its weakest level in the 2021-25 period — 21.82 to the greenback.
By the end of 2021, the peso had recovered somewhat to trade at 20.46 on Dec. 31. On that date, Reuters reported that the peso had gained “to above one-month highs … amid fewer concerns about the economic impact of a rise in coronavirus infections.”
Three days later, on Jan. 3, 2022, the peso traded at 20.58 to the dollar, while the USD:MXN exchange rate on June 30 of that year was 20.13.
On the first trading day of 2023 — Jan 2. — the peso traded at 19.48 to the greenback, an appreciation of over 3% for the Mexican currency compared to six months earlier. On June 30, 2023, the peso was significantly stronger again at 17.13 to the dollar.
At various times later in the year, the peso traded at below 17 to the dollar. MND reported on July 12, 2023, that the peso had “strengthened to 16.82 to the US dollar … on the back of data that showed that annual inflation in the United States slowed to 3% in June [of that year], its lowest level in over two years.”
On the first trading day of 2024, the peso was back above 17 to the dollar, but only just. On Jan. 2 of that year, the peso traded at 17.02 to the dollar, while on July 1, 2024, the USD:MXN rate was 18.38.
On April 8, 2024 — the day that a total solar eclipse mesmerized millions across Mexico — the peso appreciated to its strongest point of the 2021-2025 period, trading at 16.33 to the greenback. On that day, MND reported that the peso had “continued its hot streak…, appreciating to its strongest level against the dollar in almost nine years.”
At the time, Banco Base’s director of economic analysis, Gabriela Siller, attributed the appreciation of the peso to three factors: the inflow to Mexico of foreign currencies from exports, remittances and foreign direct investment; the “expectation” that the wide gap between interest rates in Mexico and the United States (11% in the former vs. 5.25%-5.50% in the latter at the time) would “attract capital to Mexico”; and the “expectation” that nearshoring would “attract waves of dollars” to Mexico.”
By the time the first trading day of 2025 rolled around, the peso was significantly weaker, trading at 20.69 to the greenback on Jan. 2 of that year. On June 30, 2025, the peso was stronger at 18.83 to the dollar, while the currency finished the year at 18.00 to the greenback on Dec. 31.
Between January 2021 and the end of 2025, the peso appreciated 10.2% against the dollar. Of the five-year periods considered in this article — five in total — the 2021-2025 interval was the only one in which the peso appreciated against the dollar. In addition, it was the only interval in which the peso’s strongest position came after its weakest position. The peso’s strongest point in the period (16.33 to the dollar in April 2024) represented a 33.6% appreciation compared to its weakest point (21.82 in November 2021).
2026: The peso continues to strengthen
Compared to the Bank of Mexico’s closing rate on Dec. 31, 2025 of 18.00 Mexican pesos to the dollar, the peso has appreciated 4.4% this year, based on the 17.24 closing rate on Aug. 5.
The El Economista newspaper reported on Wednesday, Aug. 5, that the appreciation of the peso, after closing at 17.26 on Aug. 4, was “supported by a greater appetite for risk” as currency traders remained “attentive to news about a possible [peace] agreement in the Middle East,” where the United States and Iran have been at war since late February.
Key numerical takeaways from the changes in the USD:MXN exchange rate this century
- Between Dec. 29, 2000 and Aug. 5, 2026 — this century, in other words — the Mexican peso depreciated 44.3%.
- Put differently, the US dollar appreciated 79.6% between the end of 2000 and Aug. 5, 2026.
- The difference between the highest USD:MXN rate this century (25.12) and the lowest (8.94) is 16.18 pesos.
- Between May 21, 2001, the day the USD:MXN rate was 8.94, and March 24, 2020, the day that the USD:MXN rate was 25.12, the peso depreciated 64.4%.
- The appreciation of the US dollar between May 21, 2001 and March 24, 2020, was 181%.
By Mexico News Daily chief staff writer Peter Davies (peter.davies@mexiconewsdaily.com)