



Providing broad insight into the Mexican economy
MND Intelligence · Third edition
Welcome to the third edition of the MND Economy Index™, part of the MND Intelligence™ suite of data products from Mexico News Daily.
The MND Economy Index™ is a 10-pillar, 19-indicator composite index that compiles a broad range of economic data into a single score between 0 and 100, giving Mexico News Daily readers a clear, accessible picture of how the Mexican economy is performing across multiple dimensions.
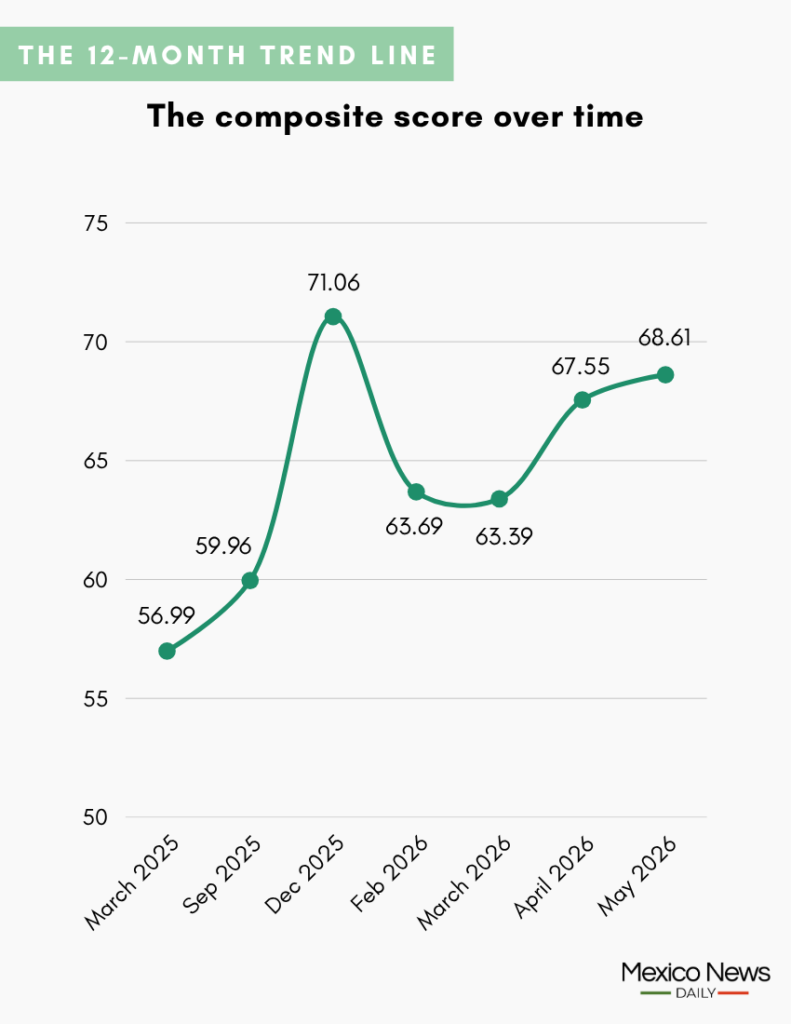
The inaugural edition of the index — using data mostly from the month of March — was published in late May. The second edition of the index, which yielded a score of 67.55 for the Mexican economy, was published in late June.
In the inaugural MND Economy Index™ article, we not only analyzed the index score — 63.39 out of 100 — but also explained what the index is, why we developed it and how it works. Click here to read (or re-read) those explanations.
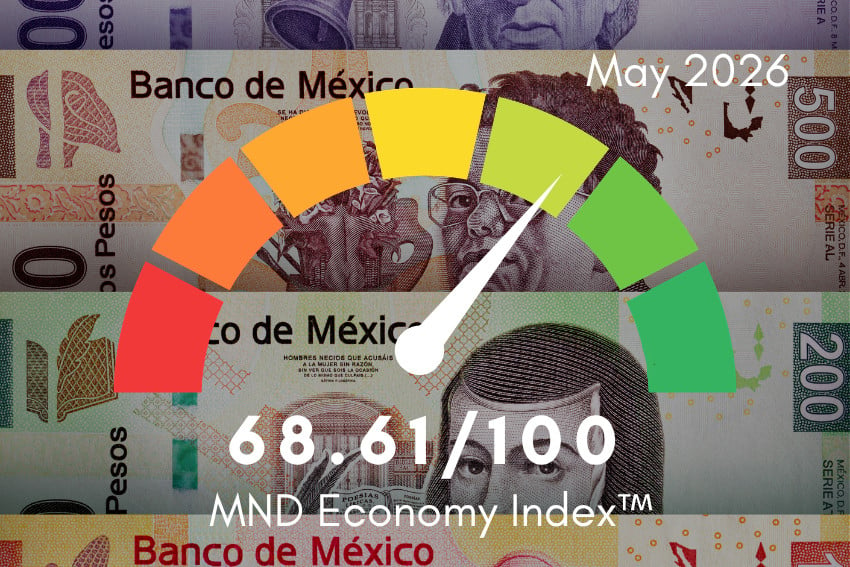
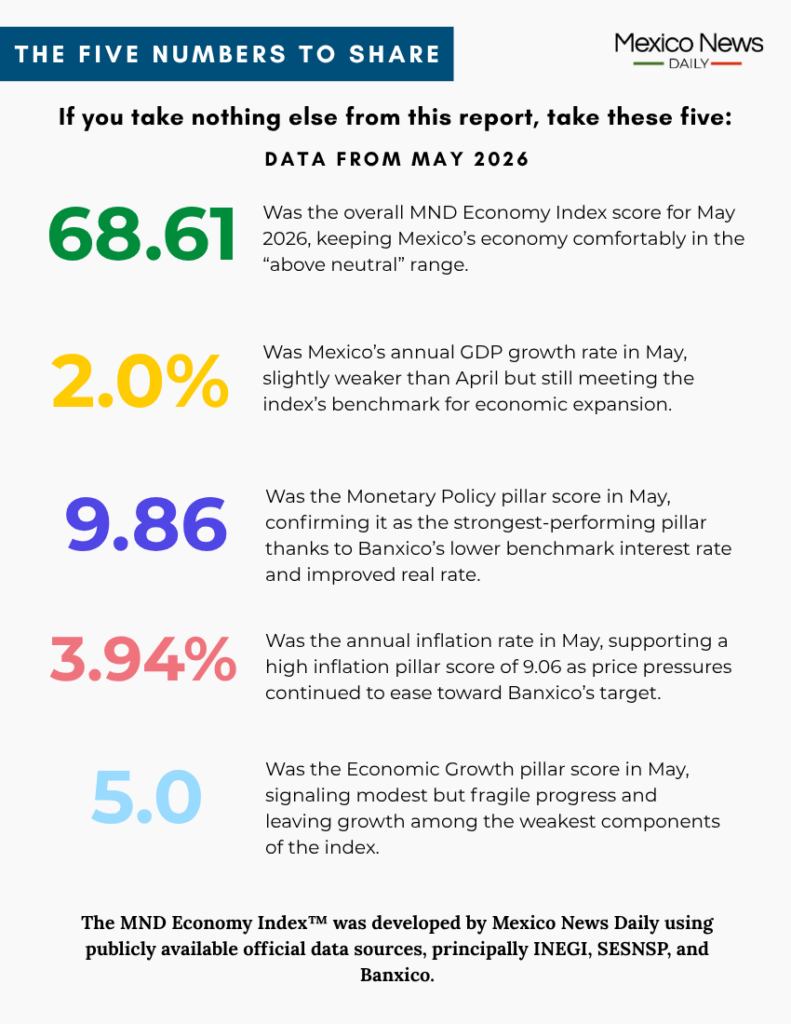
In this July edition of the MND Economy Index™ — which uses economic data primarily from the month of May — the index score increased by just over 1 point compared to the second edition to reach 68.61. That score is above the neutral benchmark of 60, but there is still significant room for improvement.
Before we look more closely at the latest index result, and the index trend in early 2026, here is a short guide to what the overall index score means.
- 85–100: Exceptional — the economy performing at a high level across nearly all indicators.
- 75–84: Strong — broad-based performance with only minor areas of concern.
- 60–74: Above neutral — meaningful strengths, but with notable room for improvement.
- 50–59: Mixed — passing marks overall, more indicators above benchmark than below.
- Below 50: Broad underperformance — more indicators below benchmark than above.
The MND Economy Index™ trend between February and May
The first two MND Economy Index™ scores we calculated for 2026 — both corresponding to the first quarter of the year — were very similar.

The first index score we calculated for 2026 was 63.69, a number derived mainly from economic data for the month of February. The index score declined slightly to 63.39 based on a calculation using data that was primarily for the month of March.
While there was little variation in the index score across those two editions, there were some significant changes in individual pillar scores, including the Inflation one and the Sovereign Risk one (see more details here).
In April, we saw the first significant movement of the year in the overall MND Economy Index™ score. In the space of a month, the score rose 4.16 points to 67.55, a clear indication that the Mexican economy was gaining strength. What was particularly encouraging was that the biggest contributor to the increase was the Economic Growth pillar, as the Mexican economy expanded 2.2% in April compared to just 0.5% in May.
While economic growth moderated to 2% in May, there were encouraging signs in other data related to the Mexican economy for that month, allowing the MND Economy Index™ score to increase for a second consecutive month to approach 70.
The July edition of the MND Economy Index™ (based mainly on May data)
As noted above, the MND Economy Index™ score for this July edition — based mainly on data for May 2026 — was 68.61, an increase of 1.04 percentage points compared to the previous month. Below you will see the score for each of the ten pillars that make up the index, expressed out of 10 to reflect each pillar’s exact contribution to the final composite score.
Pillars are color-coded using a traffic light system: green (a score above 7.5) indicates strong performance; yellow (5.0–7.5) signals decent performance but with room for improvement; and red (below 5.0) flags a pillar that is falling short of its benchmark. Where a pillar score has improved compared to the previous month, an upward arrow appears alongside its corresponding traffic light; a downward arrow indicates deterioration; and a pause symbol denotes no change.
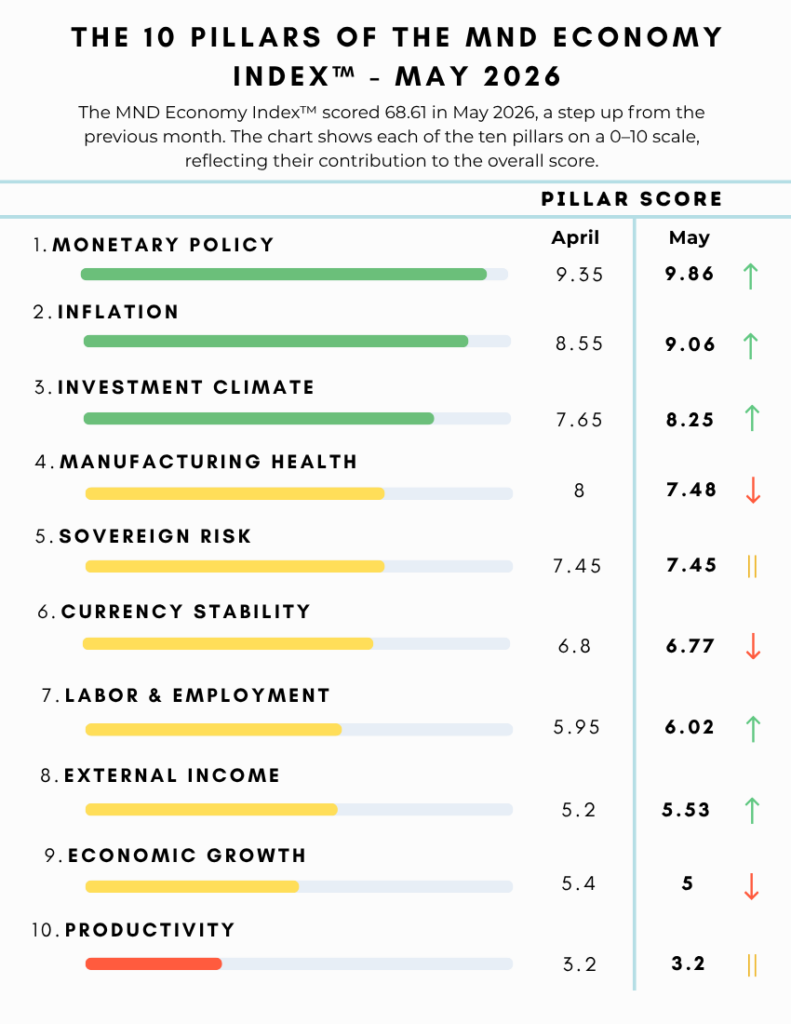
As you’ll see below, scores for five of the ten MND Economy Index™ pillars increased in May compared to the previous month. Scores for three pillars declined while two stayed the same.
There are only three green light pillars in this edition of the index whereas there were four in the previous one. A lower Bank of Mexico interest rate in May and lower inflation were among the factors that contributed to the improvement in the MND Economy Index™ score.
Weaker economic growth in May compared to April was one factor that stopped the improvement from being greater.
🟢 ⬆️ MONETARY POLICY (9.86):
The score for this pillar improved to 9.86 in May from 9.35 in April. The Bank of Mexico’s benchmark interest rate fell to 6.50% in May after a 25-basis-point cut to that level took effect on May 8.
The score for this pillar also improved as Mexico’s real interest rate — i.e., the Bank of Mexico’s benchmark interest rate minus the annual headline inflation rate — moved further toward the 2.7% neutral midpoint. The real interest rate in May was 2.56%, up from 2.30% in April.
The improvement in the overall score for this pillar ensured that Monetary Policy remained the index’s top-performing pillar in May 2026.
🟢 ⬆️ INFLATION (9.06):
The score for this pillar increased to 9.06 in May from 8.55 in April.
Inflation eased to 3.94% in May from 4.45% in April, causing an increase in the score for the current inflation component of the pillar.
The score for the pillar component that considers the 12-month forward inflation forecast remained steady — and perfect — as the Bank of Mexico anticipates an annual rate on par with its 3.0% target in the second quarter of 2027, which, of course, includes the month of May.
The inflation pillar score is poised to improve in the next edition of the MND Economy Index™ as inflation fell again in June, settling at 3.37%.
🟢 ⬆️ INVESTMENT CLIMATE (8.25):
The score for this pillar increased to 8.25 in May from 7.65 in April.
The top contributor to the pillar in April was the S&P/BMV FIBRAS Total Return Index, which tracks the performance of Mexico’s listed real estate investment trusts. The index grew 44.2% annually to the end of May, up from a 32.9% year-over-year increase at the end of April.
The score for the foreign direct investment component of the pillar remained steady as the data published by the Economy Ministry in May — i.e., the most recent available data — was also used for the previous edition of the MND Economy Index™. That data showed that FDI increased 10.4% annually in the first quarter of 2026, a result that is marginally weaker than the 10.8% growth recorded in 2025.
🟡 ⬇️ MANUFACTURING SECTOR HEALTH (7.48):
The score for this pillar declined in May, falling to 7.48 from 8 in April. Thus, the pillar’s performance was downgraded into yellow light territory.
The exports component of the pillar remained at the maximum score due to a 25.4% annual increase in export revenue in May, well above the 16.7% threshold needed for a perfect ten.
The decrease in the overall pillar score was due to a 0.1% annual contraction in manufacturing output in May. By contrast, manufacturing production increased 1.9% annually in April.
🟡 ⏸️ SOVEREIGN RISK (7.45)
The score for this pillar was 7.45 in May, the same as in April, even though there were changes in its two inherent components.
The score for the sovereign credit ratings component of the pillar declined as Moody’s downgraded Mexico’s credit score to Baa3 in May. In addition, S&P, while maintaining a BBB sovereign rating for Mexico, revised its outlook for that rating from stable to negative in May, a development that also weighed on the pillar score.
However, a narrowing in Mexico’s 5-year credit default swap spread effectively canceled out the decline in the sovereign credit ratings score. The credit default swap spread fell to 86.03 basis points in May from 89.70 basis points in April. The decline reflected a decrease in the market-implied cost of insuring against a Mexican sovereign default.
🟡 ⬇️ CURRENCY STABILITY (6.77):
The score for this pillar fell to 6.77 in May, down slightly from 6.8 in April.
The deterioration in the score occurred despite decreased volatility of the Mexican peso in May.
The standard deviation of daily exchange rate movements fell to 0.42% in May from 0.47% in April, leading to a slight increase in the score for that component of the pillar.
Thus, the decline in the pillar score in May was entirely due to a lower spot rate score. The score for that component declined as the peso strengthened against the US dollar in May to trade at 17.34 to the greenback at the end of the month, an appreciation of 0.7% compared to the end of April.
The exchange rate thus moved further away from the index’s 19.00 USD:MXN baseline, which is based on the 2025 average rate. This pillar penalizes significant deviation from the 19.00 USD:MXN baseline in either direction, recognizing that a peso that has strengthened too far from this benchmark can erode export competitiveness and reduce the purchasing power of remittances, just as a weakening peso raises import costs.
🟡 ⬆️ LABOR AND EMPLOYMENT (6.02):
The score for this pillar increased slightly to 6.02 in May from 5.95 in April.
In May, as in April, there was a 1.5% annual increase in the number of people in formal sector jobs. Therefore, there was no change in the score for that component of the pillar.
Nominal wages rose 6.6% year-on-year in May — down fractionally from 6.9% in April, but still well above the 3.5% benchmark.
The overall pillar score improved as the year-over-year growth in Mexico’s informality rate was only 0.3 percentage points in May, down from an annual increase of 0.5 points in April. Still, over 55% of all Mexican workers worked in the informal economy in May. Lowering that rate is a major challenge for the Mexican government.
🟡 ⬆️ EXTERNAL INCOME (5.53)
The score for this pillar also increased in May, rising to 5.53 from 5.2 a month earlier.
Incoming remittances grew 3.8% year-on-year — an increase compared to the 3.7% increase in March.
Thus, the score for the remittances component of the pillar increased slightly.
The pillar score also improved in May compared to April as the year-over-year decline in tourism revenue was lower. The decline in May was 0.3%, which is undoubtedly bad news. However, compared to a 2.3% annual contraction in tourism revenue in April, the result looks a little less depressing.
🟡 ⬇️ ECONOMIC GROWTH (5)
The score for this pillar fell to to 5 in May from 5.4 in April.
The decrease was due to a month-over-month decline in Mexico’s annual economic growth rate. The annual growth rate in May was 2%, according to final data published by INEGI last week, whereas the rate in April was slightly higher at 2.2%
While Economic Growth remains one of the index’s worst-performing pillars, the fact that growth reached the 2% benchmark in May can be seen as a positive, especially given the weak growth rates earlier in the year.
President Claudia Sheinbaum has predicted that economic activity will pick up in the second half of 2026 as new public and private investment projects commence. World Cup-related spending, including by international tourists, could also increase Mexico’s growth rate in June, and also possibly in July. Thus, the economic growth pillar is one to watch when we publish the next edition of the MND Economy Index™ in late August.
🔴 ⏸️ PRODUCTIVITY (3.2):
The score for this pillar remained at 3.2 in May after plummeting to that level in April from an already low 4.8 in March.
Data published by the national statistics agency INEGI in June showed that the IGPLE — INEGI’s quarterly productivity measure — increased only 0.1% annually in the first quarter of 2026. That level of productivity growth was significantly weaker than the 0.9% reading in the final quarter of 2025.
An annual productivity growth rate of 0.1% is well below the 1.0% neutral benchmark, and thus, the score for this pillar is very low.
INEGI will publish productivity data for the second quarter of 2026 in early September. We will use that data for the September edition of the MND Economy Index™.
Mexico News Daily